

Disconnect is a common hurdle between consumers and businesses. There is a saturation of information online, that causes people to feel overwhelmed. We look through piles and piles of information with no solution in sight.
Have you ever looked for a service, and come across a seemingly great company, yet when you go to their website you find yourself lost in a flood of incomprehensible text?
We thought so.
There is a way to simplify information and make it easier to find what you need.
Problems can be solved and services simplified through imagery. Yes, pictures solve problems.
Pages with pictures and images get 94 percent more views than competitors that have text only on their webpages.
But what do visuals have to do with your B2B business?
Visuals make your services appealing and understandable to your audience. These images are called infographics, and their goal is to simplify your audience’s journey.
4 Types of Infographics
Visuals are everything. Or at least a massive component of everything related to effective business marketing.
Infographics provide digestible and easy to understand talking points on various topics. They are data visualizations that use charts, images, and limited text to keep your reader engaged.
If you want to provide quick and straightforward information to your audience, then you’ll want to incorporate some infographics on your website.
Let’s dive in.
Interactive Infographics
Interactive infographics are an eye-catching and shareable way to display data. They give your audience the option to see if your services are for them or if it best fits someone else they know. Now that’s feeding two needs with one deed.
Interactive infographics feature clickable images, illustrations, and widgets so your audience can learn valuable information about your services at their own pace. They’re also a great way to keep your audience engaged, and to tell a compelling story that’s filled with detail.
Let’s say you’re in the wellness industry and you are having a hard time showing your clients how your services can better their quality of life. Using interactive infographics can visually map your clients progress. They can pinpoint areas your clients want to improve in and click through your services to see how each one directly applies to their problems. This kind of infographic gives your clients the power to personalize your services to suit their needs. Results will follow.
Google Chrome does a great job at using interactive infographic that allows users to explore the growth of the world wide web. This infographic brought to life, what would have been dry and overwhelming content.
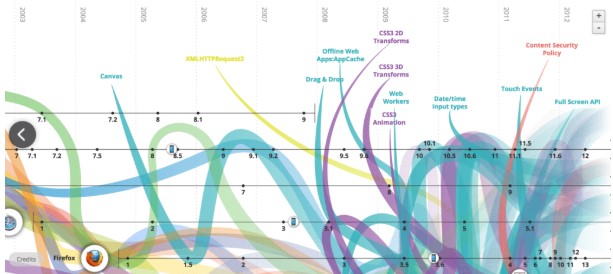
Using interactive infographics on your business page helps your audience have a more in-depth user experience. Your audience will feel empowered to learn in a way that serves them best. People connect better with visuals, so help your audience imagine a better life with your services.
Process Infographics
Do you have a complicated service?
Let’s say you are a law firm and you win cases all the time. Your website has a long list of lawyer jargon that shows you win cases and you have the expertise to help potential clients. That is fine and dandy for others in your industry to understand what you do, but the majority of your audience doesn’t understand lawyer lingo. Your audience wants to win, but they also want to feel confident that they should trust you with their case.
How can you demonstrate that to them? Not to worry. Process infographics come into play and make both your audience’s and your life easier.
Your firm can break down the complexities of law processes for your audience using process infographics. These visuals will simplify case handling processes in human terms. Your audience will then understand how the law works and feel confident that you are more than qualified to take on their case.
Process infographics are specifically designed to simplify complex ideas and concepts through visuals.
This kind of infographic is also referred to as a flow chart, which takes advantage of the short attention span of the modern human. There are many types of process infographics available, but here is an overview of the three most effective ones.
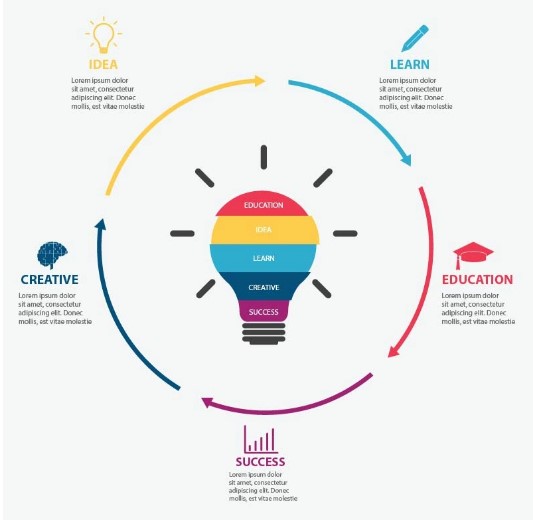
Circle Process Infographics
If you are a learning institute a circle process infographic would be a great illustration to show undergraduates, transfer or master’s students. This will effectively outline the steps necessary to flourish doing school and graduate on time. Below are other ways circle process infographics can be useful.
- Assist people with visualizing steps to take and the order to execute them in
- Support repetitive learning processes that track improvements
- Guide your audience toward visualizing their final goal
Venngage does a great job of breaking down the complexities of product designs below.
3D Infographics
3D infographics can be applied in many different industries. This would be a great visual to use in the mental health industry. You can create a 3D infographic of the brain and feature 3D elements that show how trauma and depression affect brain activity. Your readers can observe how powerful negative events are on the brain. 3D infographics will breathe new life into an otherwise uneasy subject matter. Here are some other perks of 3D infographics.
- Designed for multiple outcomes
- Goes into greater detail through realistic images
- Creates clarity and memorable imagery
Pyramid Infographics
Pyramid Infographics work well for companies that handle digital marketing strategies or consulting services. You can show your clients a simplistic way to their goals.
Although it may be a lengthy journey, having a visual like the pyramid infographic will make your prospective clients’ objectives seem easily obtainable. Here are some other ways to apply pyramid infographics:
- Contain a straightforward process to reach objectives
- Simple yet effective
- Can use colors to showcase critical stages
Color schemes are essential when using process infographics as they can hurt or compliment your brand messaging. You want to create a visual that is appealing and relays a concise message.
If you want to learn more about colors and their impact on websites, check out our blog on design website trends.
Comparison Infographics
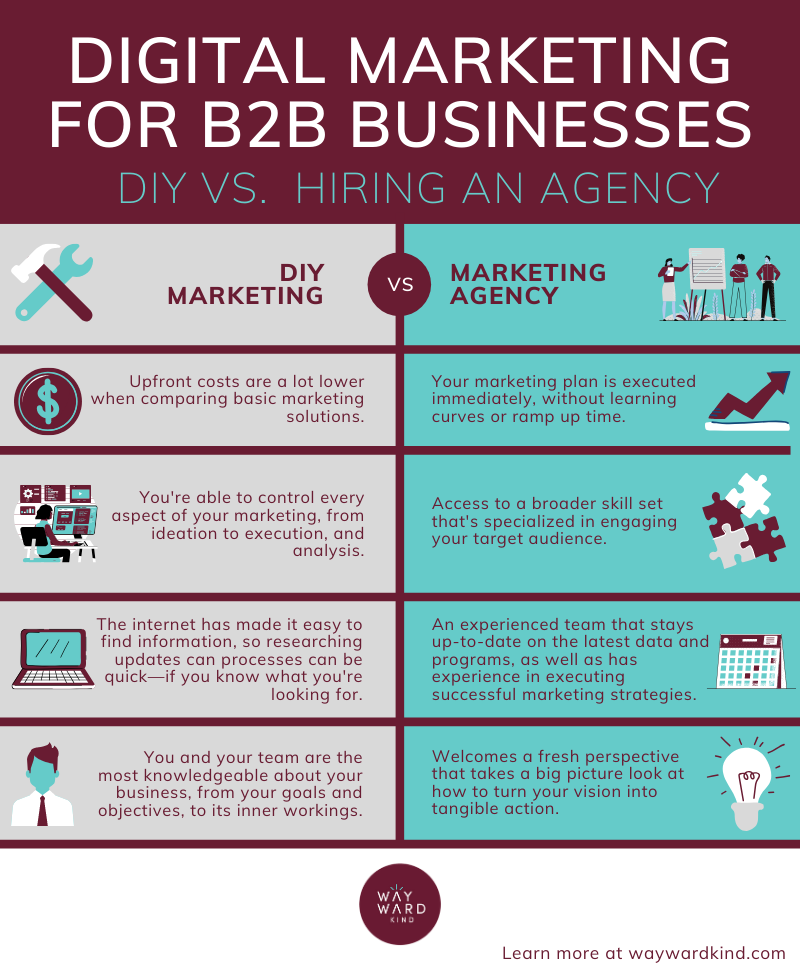
Comparison infographics allow your audience to look at services side by side and identify essential elements quickly. They work great for your business by highlighting what makes your services unique and more useful than your competitors.
Here’s an example of a comparison infographic that shows the distinction between Do-It-Yourself (DIY) marketing, and hiring a digital marketing agency.
Comparison infographics showcase the results of your services by sharing before and after visuals from clients. These provide your audience with credible images to make them confident that your services will work for them.
Any business with visible results can use a comparison infographic to showcase previous work to potential clients. These comparison charts can effectively demonstrate the results you bring to the table. People love to see before and after pictures because they show progression and help them envision themselves with a new brand image.
When you are creating a comparison infographic, ensure your messaging is consistent throughout the chart. It wouldn’t be useful to compare your consulting services to a financial services company because they are separate industries and messages to different audiences with unique needs.
Include the most important information in your comparison charts and don’t stray away from your core messaging. The goal is to create clear and organized information; anything more than what is necessary creates a messy and confusing visual frenzy for your audience.
Timeline Infographics
Timeline infographics combine extensive time periods and events into little nuggets of enjoyment. This infographic should take your audience on a captivating journey through your business history, milestones, and even your bio.
People invest in companies they trust. A financial services business can display their stability and expertise by including a timeline infographic on their webpage. This allows your audience to independently scroll through milestones and historical moments in your company’s history. The timeline infographic will assist them in trusting your company of all their banking needs.
It is essential to focus on the overall objective when creating your timeline. Start by creating an outline of events in chronological order. It can include a brief context of what you’d like to cover, add compelling images, and short pieces of text.
Venngage does a great job of using brief statements that include dates and illustrations below.
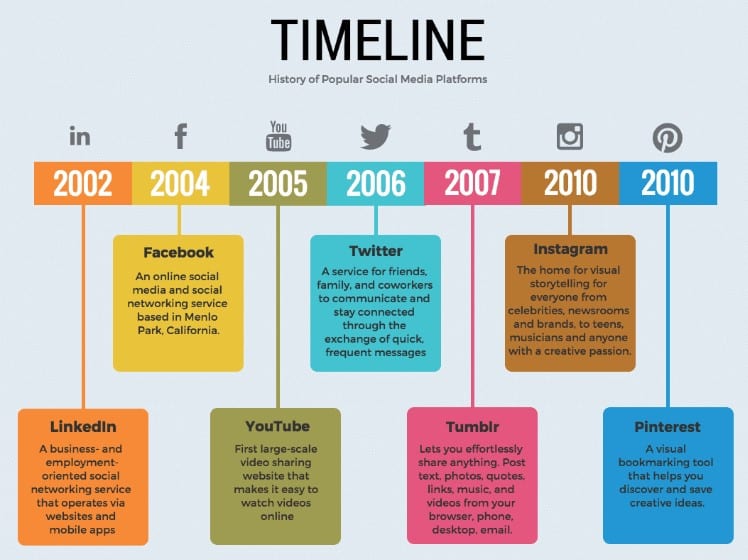
Timeline infographics help with your content marketing by laying out what your services can do for your audience in a certain amount of time. These visuals spike their interest and, if used consistently, can aid in expanding your audience reach.
Here are three layout formats you can try for your next timeline infographic:
Horizontal
- Suitable for short timelines such as milestones
- A staple
Snake
- Useful when including a lot of key points, and limited text
- Space efficient
Vertical
- Most popular and symmetrical
- Flexible if additional information needs to be added, layouts are important
Unforgettable Images
The purpose of using infographics is to turn drab content into exciting tidbits for your audience. These visual elements should always reflect your brand and be clear and straightforward. Remember, you want to create an infographic that highlights why your services are better than the next businesses. Show your clients you care by creating educational and interactive solutions.
At Wayward Kind, we are all about creating messaging that mirrors your authenticity and resonates with your audience. Let’s create images they won’t forget now.
I want to create memorable imagery.

We can help you master your digital marketing strategy with CRO tips. Our team of strategists are experts at understanding you and your audience. Whether it’s setting up Google Analytics, or creating great landing pages, Wayward Kind is all about action. Ready to convert to a mindful marketing strategy? Contact us today!